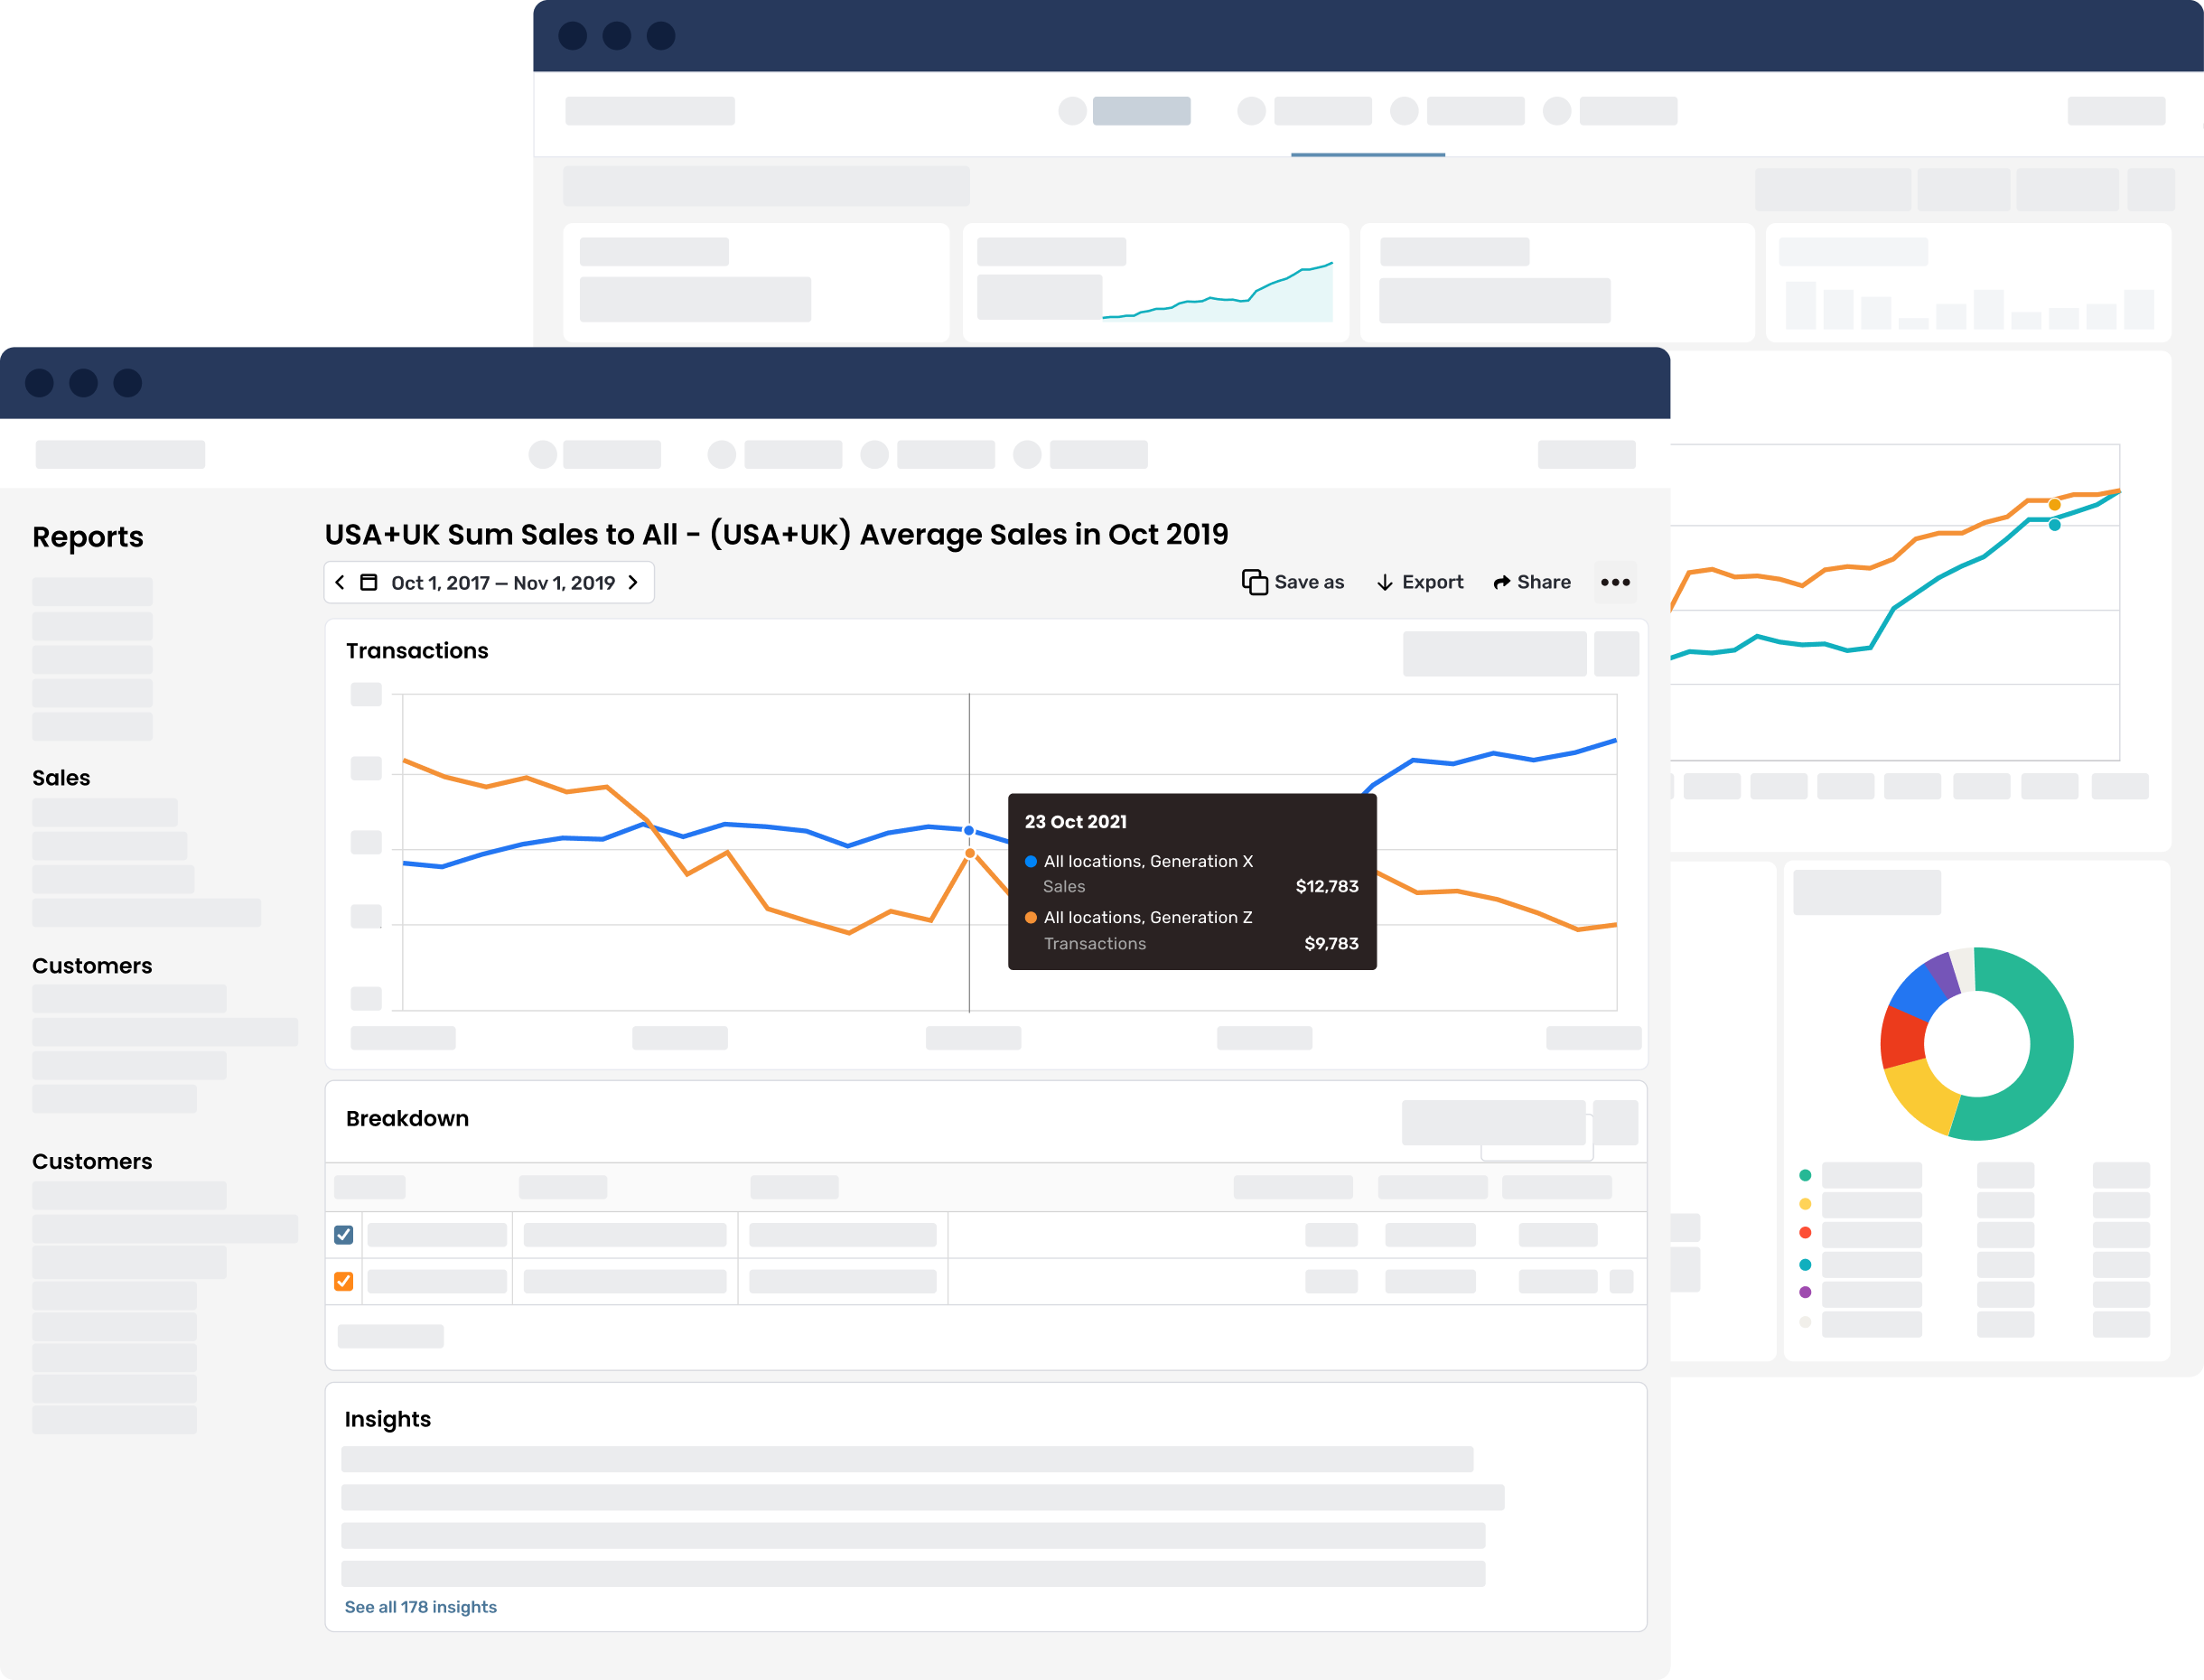
Turn your data file
into an app.
The no-code solution to turn data into beautiful reports in minutes.
23 Oct 2020 2:41
Sales to Millennials in New-York increased ↑118% more than other generations
23 Oct 2020 2:41

Sales to Millenials in New-York increased ↑118% more than other generations
Zero to dashboard in minutes
Quickly build and share beautiful, customized, and dynamic dashboards that showcase your data with just a few clicks.
Slice-and-dice
Static reports are a thing of the past. Dive-down into any report by filtering or segmenting your data without writing any code.
Easily explore data no matter your skillset
Easily explore with our no-code report builder or run deeper analysis by writing your own SQL or R code.
